
Usage history
Under the live gauges on a server's Console tab, the usage chart shows CPU and memory over time, with ranges of 1 hour, 6 hours, 24 hours, 7 days and 30 days.
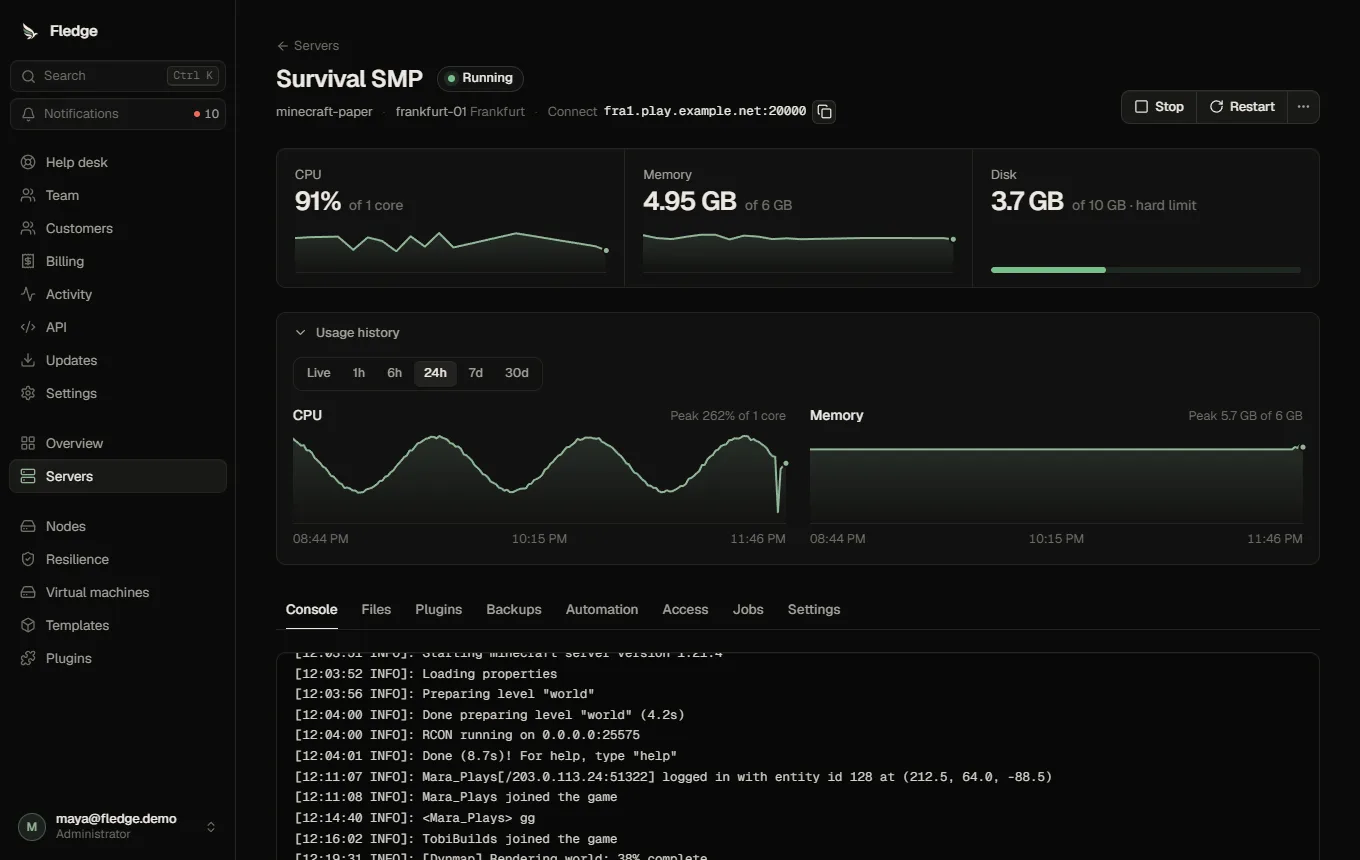
- Samples come from the node's heartbeat and are aggregated by the API in memory, then written as one-minute, five-minute and one-hour buckets. The chart picks the bucket size for the range.
- Each point shows the average and the peak.
- Disk use is shown as a separate figure from the node's disk samples.
- Old buckets are trimmed automatically (one-minute data after about a day, five-minute after about a week, hourly after about a month).
API: GET /api/servers/:id/metrics?range=1h|6h|24h|7d|30d.